
MATHEMATICAL APPROACH MODEL
Whatever cementation with whatever bonding agent has its setting time, also for BIO DUST has its setting time due to the Dust Control Effect Process. As long as the setting time period, the object of the bonded material which has sprayed or mixed with bonding agent should not be destroyed by shaking or whatever dirturbance. This philosophy also used for BIO DUST as long as dust control bonding process. But its impossible to stop the traffic during this cementation, and also many parameters should be thought to be approached such as :
Kind of dust material compared with our trial on the laboratory test (more and more light),so its need more BIO DUST concentration than our laboratory test or our trial on RAPP – Pelalawan – Pekanbaru.

Intensity of the traffic, on the access road of RAPP pulp plantation is very high intensity of various traffic flow, especially loging truck traffic.
Traffic load, loging truck traffic is very high load capacity from 50 ton to 125 ton tare load for every truck/lorry. All of those phenomenon should be approached by mathematical model of several trial. In this trial we take 3 times of trial with projected increment of the dust effect of BIO DUST of each trial as described on the Figure-2.
Try Out of BIO DUST for dust control held on RAPP started on July 17th 2005 with on progress data, part of data described below:
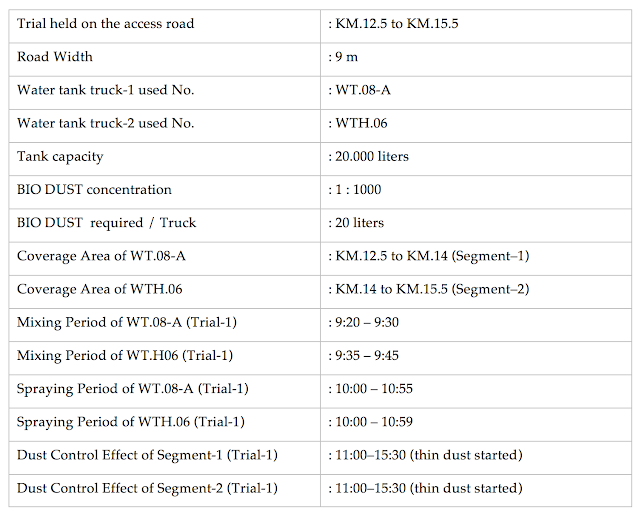
The summary of those data is described on Figure-2.
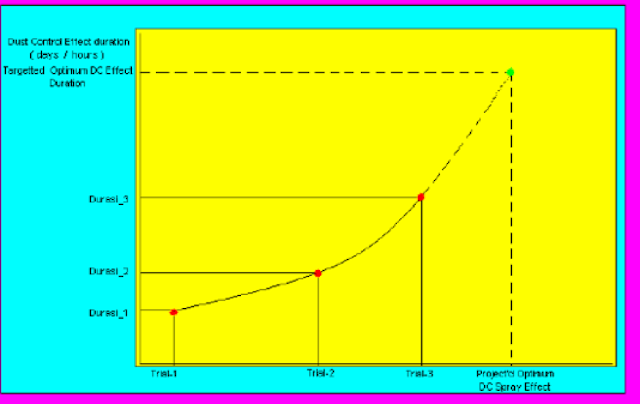
Figure-2 : Observed trial 1, 2 and 3 for projected targeted duration of dust control
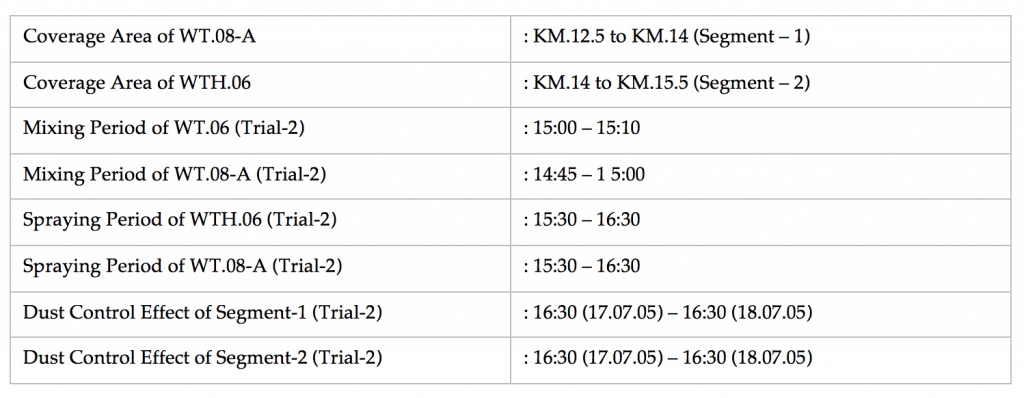
The Second Trial Summarized as follows dated July 17th 2005 :
The Third Trial Summarized as follows dated July 19th 2005 :

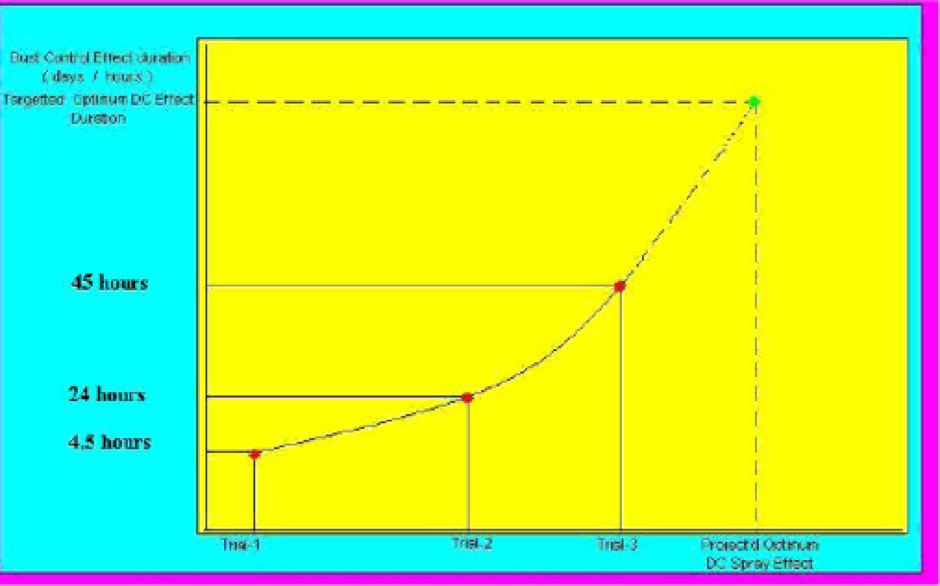
Figure-3 : Actual Data from RAPP Try Out BIO DUST Dust Control Effect on the Access Road KM 12.5 to KM 15.5 date July 17th 2005 to July 21‘05

BIO DUST Trial Use/Pilot Project Documentation July 17th – July21st 2005
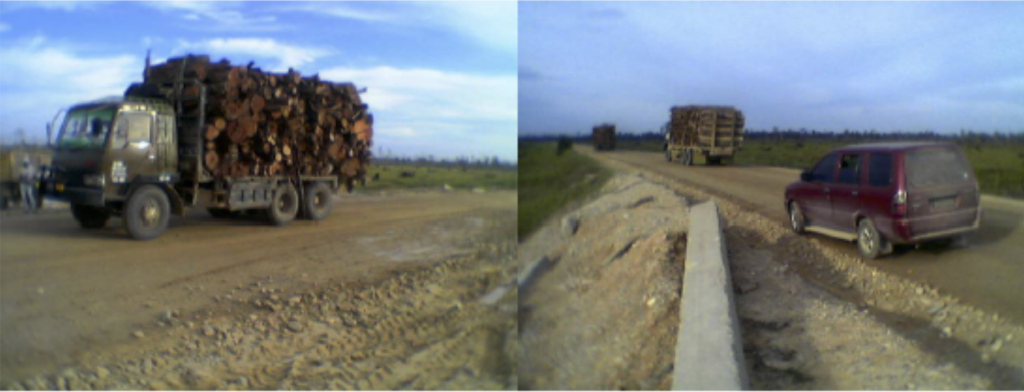
Fig. 8 : Spraying Bio Dust Effect after First Stage Spraying + 4 hours
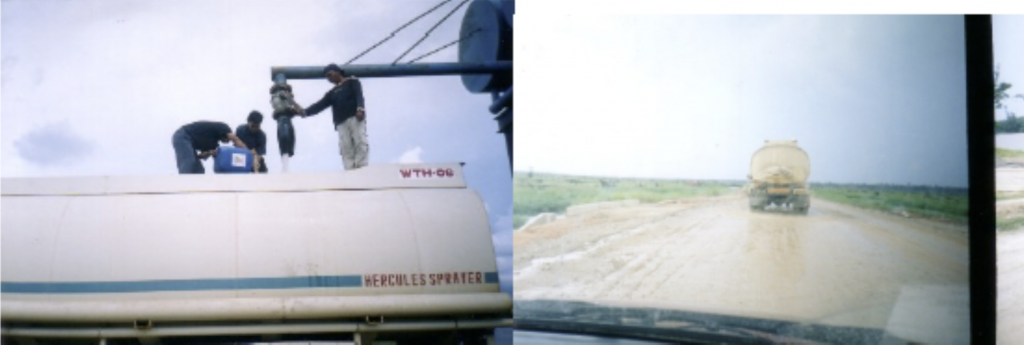
Fig. 10 : 3rd Stage Spraying mix 20 Litres Bio Dust to 20.000 Litres water in water tank (19.07.2005) Fig. 11 : 3rd Stage Bio Dust Spraying (19.07.2005)
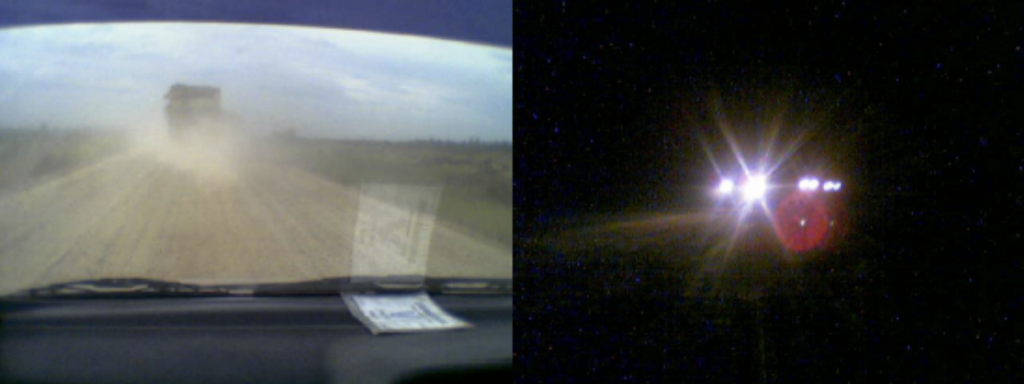
Fig. 12 : Another Road Segment Observation After Spraying Water + 10 minutes (dusty again) Fig. 13 : Observed Segment Treated with Bio Dust Third Stage Spraying on night view
Fig. 14 : Spraying Bio Dust Effect observation after17 hours
Fig. 15 : Spraying Bio Dust Effect observation after 22 hours
Fig. 16 : Spraying Bio Dust Effect observation after 90 hours
Fig. 17 : Spraying Bio Dust Effect observation after 96 hours
Fig. 18 : Dusty Truck before entry Bio Dust treated Zone
Fig. 19 : After entry Bio Dust treated Zone gradually thedust disappear.